There are so many ways to do web development today. But the most common scenario you are going to encounter, is debugging a web page.
Whether you are in jQuery or AngularJS, at some point you will need to display a variable’s value or break somewhere that is hard to reach. The best tool for me to debug a web page is Google Chrome but some of those tricks might work in other browsers.
So let me show you my favorite, yet less known, tricks about debugging web pages.
console.table
Have you ever had an array with lots of rows and start expanding the values looking for a specific object?
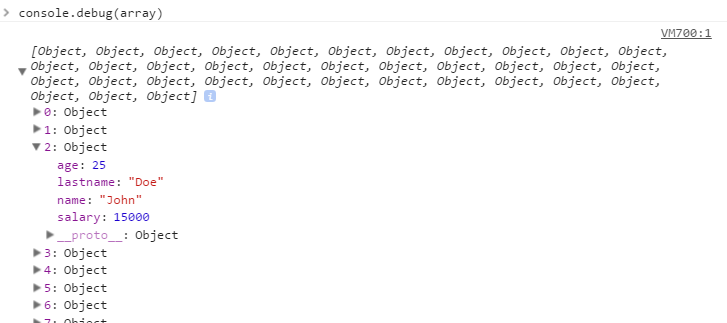
Well there is a better way.
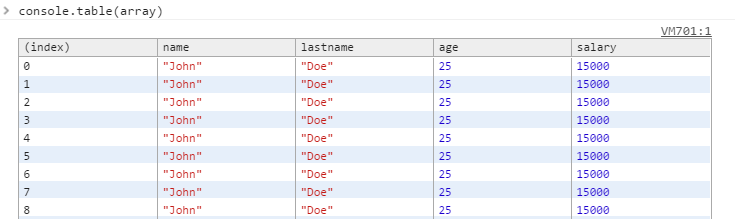
If you only want certain properties you can even pass in the fields you want.
1 | console.table(array, ["name", "age"]) |
So stop expanding your objects one by one and use console.table to view them all at once.
debugger
1 | function myFunction() { |
This one is easy. If the developer console is opened, your browser will break on the debugger line as soon as it reach it. Of course, be aware that you cannot disable this breakpoint.
DOM elements in the console
Have you ever displayed a DOM element in the console?
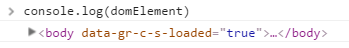
But what if you want to see the actual JavaScript properties of the DOM element? console.dir(...) is your friend.
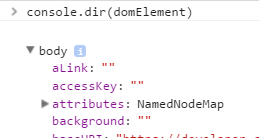
console.dir force the JavaScript representation of any object that you are trying to display.
Profiling your code
Sometimes, code runs slowly. Profiling with Chrome is extremely easy. You click start, you run your piece of code and you press stop. Easy right?
But that will record anything that happens at that moment. What if the problematic code is located in a specific execution path in you want to just profile this part? I have the solution for you.
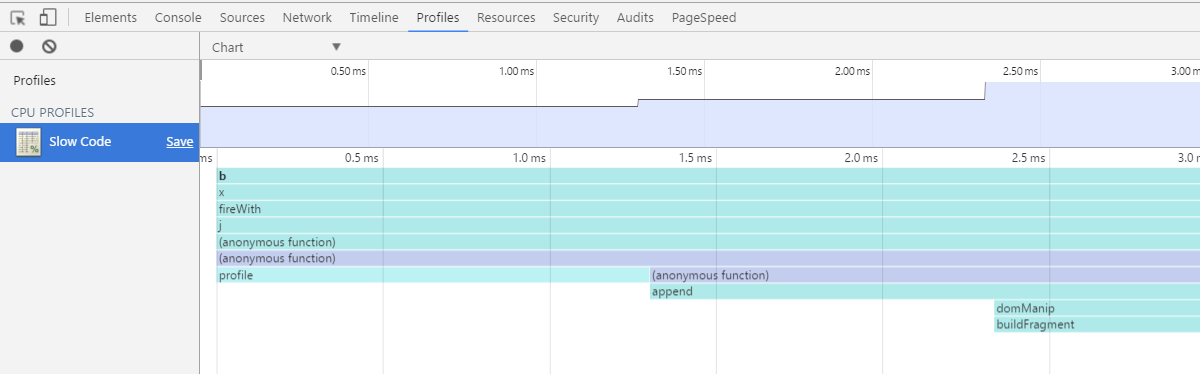
1 | function (){ |
Running this type of code will give you this output in your Profile tabs in Chrome Developer tools.
Debugging devices
You are probably developing on a desktop (or laptop) with a large display resolution. However, mobile is also an important focus for your organization when developing web apps.
How do you test multiple resolutions? Different media queries?
Most people resize their browsers. Let me show you a better way.
First activate the device toolbar by clicking here.
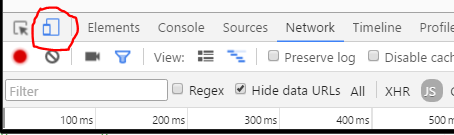
You will then see this bar at the top.
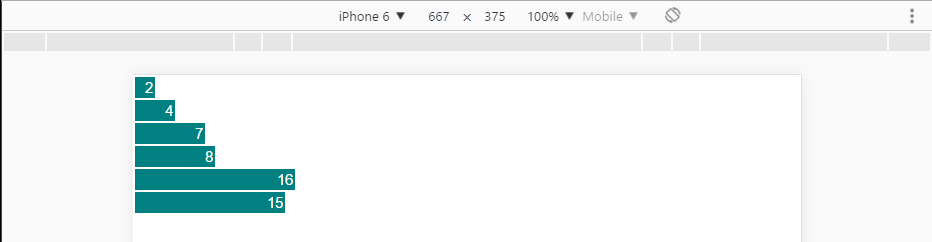 .
.
Do you see the three dots on the right? Click on it.
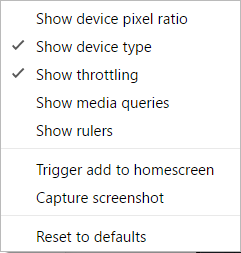
From there, you can activate media queries, rulers, media queries and really boost what you can do with Chrome.
Need to test specfici media queries? Yep. Need to test your website on a GPRS connection? 2 clicks away. Resize your viewport? Easy!
Wrapping it up
Of course, there is so many more things that can be done with Chrome that I could talk about but I decided to focus on those that I used the most.
I will however leave some links that will allow you to explore more options!